BRIEF SUMMARY
Ty Schuiling’s paper, “What’s with Oil – the Probable Status of the Resource,” describes the history of petroleum discovery and production in leading oil-producing areas of the United States and the world. It then considers the prospects for its future production , using concepts pioneered by the noted geophysicist M. King Hubbert in the 1940’s and 1950’s, and more recent applications by the United States Geological Survey, the Association for the Study of Peak Oil, and the United States Energy Information Administration. These are reviewed and compared, leading the author to question the degree to which the world petroleum supply situation is being truthfully represented to the American public by one of the federal agencies responsible to provide objective information on energy resources to policy makers and consumers. The paper concludes with statements by respected figures in the energy industry and a perspective on the topic from Hubbert’s classic paper “Energy from Fossil Fuels” in the February 4, 1949 journal Science.
THE AUTHOR
Ty Schuiling is a native of San Bernardino, California. He graduated from the University of California, Riverside with an undergraduate degree in geology and received a Masters degree in Economic Geology from the University of Arizona after work with the US Geological Survey, Union Oil Company, and US Borax. From 1979 until its liquidation in 1986, he held positions as an exploration geologist and manager for Anaconda, a subsidiary of Atlantic Richfield. Following completion of a Masters in Urban and Regional Planning from the University of Colorado, he worked as a project manager for a national engineering consulting firm before joining San Bernardino Associated Governments (SANBAG) in 1990 as Director of Comprehensive Planning. Since 1997 he has served as SANBAG’s Director of Planning and Programming. He is married to Elizabeth Schuiling and has two daughters, Andrea and Sarah.
What’s with Oil?
The Probable Status of the Resource
Overview
As petroleum prices rise in response to, according to the media, civil unrest in Nigeria, bad weather in Mexico and the Gulf, an unfriendly government in Venezuela, the war in Iraq, deteriorating relations with Iran, pipeline problems in Alaska, conspiracies to limit production by certain OPEC countries and a host of other reasons, one may be inclined to ask what is it, what is its history of discovery and production, what are the prospects for its future production, and to what degree is this being truthfully represented to inform the decisions of its consumers?
Petroleum or crude oil is a naturally occurring, flammable liquid that consists of a complex mixture of hydrocarbons plus other organic compounds. The proportion of hydrocarbons in the mixture is highly variable and ranges from as much as 97 percent by weight in lighter oils to about 50 percent in the most viscous oils or tars. The non-hydrocarbon fraction of the crude oil consists mostly of organic compounds of nitrogen, oxygen, and sulfur. Trace amounts of iron, nickel, copper, vanadium, and other metals may also be present. The exact molecular composition varies widely from oil field to oil field, but the proportions of the chemical elements vary within a narrow range.1
Crude oil varies greatly in appearance depending on its composition. It is usually black or dark brown, although it may be yellowish or even greenish. In the reservoir it is often found under a cap of less dense natural gas, and is usually underlain by water of varying salinity which, of course, is more dense. Crude oil may also be found in semi-solid form mixed with sand, as in the tar sands of Alberta, Canada. Oil has been the world’s most important source of energy since it superceded coal in the mid-1950s, because of its high energy density, easy transportability, and relative abundance. Most of today’s modes of transportation are powered by it, and for one mode, aviation, no real alternative to petroleum based fuel has been identified. Petroleum is also the raw material for many chemical products, including pharmaceuticals, solvents, fertilizers, pesticides, and plastics as will be discussed later. Worldwide production of conventional petroleum and lease condensates (lighter liquid hydrocarbons recovered onsite from the natural gas fraction of well output) has been about 84 million barrels per day for more than two years; annual totals during that time have been slightly over 30 billion barrels.
Recovery
Petroleum is found in porous rock formations in certain relatively shallow strata within the Earth’s crust. Known remaining reserves of conventional, recoverable petroleum are typically estimated by the United States Geological Survey and others at about 1 trillion barrels without tar sands, about 3.7 trillion barrels including tars sands, and more if an oil shales which contain high concentrations of kerogen, a petroleum precursor that can be converted to petroleum by heat, is counted. Because the energy return over energy invested (EROEI) ratio of oil is constantly falling as petroleum recovery gets more difficult, recoverable oil reserves are significantly less than total oil-in-place.
Primary recovery relies on the natural underground pressure in the oil reservoir to force the oil to the surface. Gaseous fuels, natural gas, or water are usually present, which also supply needed underground pressure. During primary recovery, it is sufficient to place valves on the well head to connect the well to a pipeline network for storage and processing. Usually, about 20 percent of the oil in a reservoir can be extracted using primary recovery methods.
Over the lifetime of the well the pressure will fall, and at some point it will be insufficient to force the oil to the surface. It is often economical then to continue extraction using secondary oil recovery methods. Pumps may be used to bring the oil to the surface or techniques may be used to increase the reservoir’s pressure, such as water injection, natural gas reinjection and gas lift, which injects air, carbon dioxide, or some other gas into the reservoir. Primary and secondary methods in combination generally allow 25 to 35 percent of the reservoir’s oil to be produced.
Tertiary oil recovery further increases total production through methods that reduce the oil’s viscosity or it adhesion to the reservoir rock. Thermally enhanced oil recovery methods (TEOR) are tertiary recovery techniques accomplish this by heating the oil. Steam injection is the most common form of TEOR, and is often done with a cogeneration plant. In this type of cogeneration plant, a gas turbine is used to generate electricity and waste heat is used to produce steam, which is then injected into the reservoir. In situ burning is another form of TEOR, but instead of steam, some of the oil is burned to heat the surrounding oil. Occasionally, detergents are also used to decrease viscosity or adhesion. Another method is carbon dioxide flooding, which works on the premise that by injecting CO2 into the reservoir, the viscosity of any hydrocarbon will be reduced and hence easier to sweep to the production well. Tertiary recovery allows another 5 to 15 percent of the reservoir’s oil to be recovered.
If you’ve been tabulating these numbers, you’ve realized that the combination of these techniques may accomplish a total recovery ranging from one third to one half of the total crude oil resource, therefore the need to speak in terms of “readily recoverable” or “reasonably recoverable” resources. In short, if cost were no object, and there were no concern about net energy, that is, expending more energy in the recovery and refining effort than is contained within produced crude itself, recovery could indeed be pushed beyond 50 percent. However, beware those who fail to account for these factors in their estimates of remaining resources.
Formation
Petroleum formed from the remains of zooplankton and algae that lived in the ocean between 10 to about 160 million years ago. When the organisms died and sank to the bottom, they were rapidly covered by mud, sand, or other mineral deposits that prevented immediate decay as would normally occur to organic materials that remain exposed on the sea floor. If the sediments were sufficiently anoxic, decay would occur slowly to carbon-rich compounds in the shaley strata, a potential source rock for the petroleum. As deposition continued and the depth of burial increased, a combination of heat and pressure during diagenesis caused chemical conversion of the organic compounds, first to kerogen as found in various “oil shales” throughout the world, and then if heating is sufficient, to oil and then to natural gas.
Petroleum geologists speak of an “oil window,” the temperature range in which oil forms. Below that as noted previously, organic material is converted only to kerogen, and above the window, oil is further converted to natural gas. Oil window temperatures can be achieved at different depths depending on the thermal gradient of a given site, but typical depths are four to six kilometers. However, the liquid or gaseous hydrocarbons formed at those depths are less dense than either rock or groundwater, and migrate upward along permeable zones in adjacent rocks until they either reach the surface (such as the case with the La Brea tar pits) or are trapped beneath impermeable rocks. If the rock into which the oil migrates below the impermeable cap is sufficiently porous and permeable and the volume of migrating oil is substantial, the oil in effect pools beneath the cap to form a reservoir which, upon extraction, becomes an oil field. The lateral distance between source rocks and reservoir can be many tens of kilometers, particularly in cases in which a pronounced groundwater gradient assists the lateral migration.
So in summary, major oilfields, like rich deposits of metallic ores, are freaks of nature; reflecting a fortunate combination of source rocks reaching temperatures hot enough to form oil without thermal cracking to natural gas, permeable zones for it to migrate, a porous and permeable rock to host the reservoir, and a cap to trap it in a subsurface zone. It is generally believed that most of the oil formed throughout geologic history has long ago escaped to the surface and been consumed by oil-eating bacteria. Essentially all the modern world’s petroleum production has come from the small fraction of these resources that have enjoyed the above rare combination of circumstances.
Uses of petroleum
Most of the world’s petroleum production is currently dedicated to powering our transportation systems. This was not always the case as shown in Figure 1.
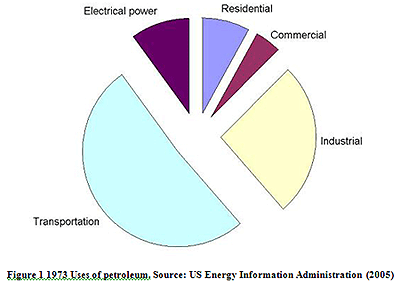
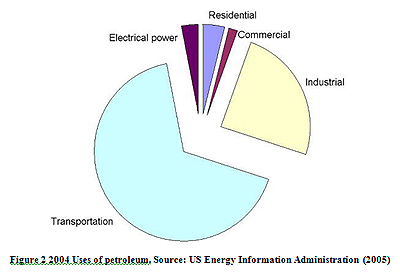
Petroleum production and consumption increased by about 25 percent during the period 1973 to 2004, so declines in proportionate use are at least partially offset by the increased total. Note too that the proportion of production dedicated to industrial uses remained constant (which reflects a substantial absolute increase); among these uses are fertilizers and pesticides needed to support world food production, pharmaceuticals that support advances in the medical field, and high-tech materials used in the manufacture many important products.
History of petroleum production
According to Herodotus and confirmed by Diodorus Siculus, asphalt was employed in the construction of the walls and towers of Babylon more than 4,000 years ago;4 oil pits were located near Babylon, and considerable quantities were found on the banks of a tributary of the Euphrates River. Ancient Persian tablets indicate the use of petroleum in medicines and lighting within the aristocracy. The earliest known oil wells were drilled to depths as great as 800 feet in China by no later than 347 CE (AD). They were drilled using bits attached to bamboo poles.5 The oil was burned to evaporate brine for salt production. By the 10th Century, extensive bamboo pipelines connected oil wells with salt springs.
Middle East petroleum production was in place by the 8th Century, when the streets of Baghdad were paved with tar derived from nearby natural sources. In the 9th Century, oil fields were exploited in the area around modern Baku, Azerbaijan, to produce naptha. These fields were described by the geographer masudiin the 10th Century, and by Marco Polo in the 13th Century, who described the output of those wells as hundreds of shiploads. Petroleum was distilled by Persian chemist al-Razi in the 9th Century to produce chemicals such as kerosene.6
The earliest mention of American petroleum occurs in Sir Walter Raleigh’s account of the Trinidad Pitch Lake in 1595. Thirty seven years later, the account of a visit of a Joseph de la Roche d’Allion to the oil springs of newYork was published in the Histoire du Canada by Sagard. Peter Kalm, a Russian traveler, published a work on America in 1748 that included a map which showed oil springs in Pennsylvania.4
In 1711 the Greek physician Eyrini d’Eyrinis discovered asphalt at Val-de-Travers in the canton of Neuchatel, Switzerland, and established a bitumen mine there in 1719 that operated until 1986.7 Oil sands were mined from 1745 in Merkwiller-Pechelbronn, Alsace under the direction of Louis Pierre Ancillon de la Sablonniere by special appointment of Louis XV.8 The Pechelbronn oil field was active until 1970,and was the birthplace of the noted petroleum production support corporation, Schlumberger. The first modern refinery was built there in 1857.
In 1846, Nova Scotian Abraham Pineo Gesner discovered the process of refining kerosene from coal. By1852, Ignacy Lukasiewicz had improved on Gesner’s method by developing a process to instead refine kerosene from petroleum, and the first petroleum “mine” was built in near Krosno in Galicia in the following year. These technologies spread rapidly, and Meerzoeff built the first Russian refinery in the now-mature oil fields at Baku in 1861, at which time the Baku fields produced most of the world’s oil.
The first commercial oil well drilled in North America was in Oil Springs, Ontario, Canada in 1858, by James Miler Williams. The US petroleum industry began with Edwin Drake’s drilling of a 69-foot oil well in 1859, on Oil Creek near Titusville, Pennsylvania, for the Seneca Oil Company. The well initially yielded 25 barrels per day but production declined rapidly to only 15 barrels per day in that same year. The petroleum industry grew very slowly in the latter 1800’s, driven by demand for kerosene and oil lamps, replacing whale oil. However, the introduction of the internal combustion engine in the late 19th and early 20th centuries created a demand that has been a principal driver of the industry to this day, and early modest finds such as those in Ontario, Canada and Pennsylvania were shown inadequate to meet demand, leading to oil booms in Texas, Oklahoma, and California. From a nationwide annual production of about 2,000 barrels in 1859, US production began to accelerate and reached about 60 million barrels at the turn of the century.
By 1885, significant oil fields had been discovered on the island of Sumatra, Indonesia, and by 1910, major discoveries had occurred in Ontario, Canada, Iran, Peru, Venezuela, and Mexico. However, in many respects the United States led the way in the development of its petroleum resources. The following details the experiences in the leading oil producing states of the US, followed by discussion of the world’s largest foreign deposits, from which some generalizations can then be made.
Texas
The real Texas oil saga began on January 10, 1901 when, spurting drilling pipe, mud, gas and oil, the Lucas No. 1 well blew in at Spindletop near Beaumont. The gusher spewed oil more than 100 feet into the air until it was capped nine days later.9 The presence of natural oil seeps in Texas had been known for hundreds of years before Europeans arrived in the area. In July 1543, the remnants of Spanish explorer Hernando de Soto's expedition, led by Luis de Moscoso Alvarado, were forced ashore along the Texas coast between Sabine Pass and High Island. Moscoso reported that the group found oil floating on the surface of the water and used it to caulk their boats.
Lyne T. Barret drilled Texas' first producing oil well in 1866 at Melrose in Nacogdoches County. Other wells followed, making Nacogdoches County the site of Texas' first commercial oil field, first pipeline and first effort to refine crude. Several thousand barrels of oil were produced, but the price of oil was not high enough to justify further efforts at development.
City crews in Corsicana were drilling for water in 1894, when they made the first economically significant oil discovery in Texas. That well was abandoned because the drillers needed to find water, not oil. But several producing oil wells were drilled in 1895 by Joseph S. Cullinan, who later helped found the Texas Company, which became Texaco. The first well-equipped refinery in Texas was built at this field, and despite the early efforts at Nacogdoches, it is usually called Texas' first refinery.
Spindletop - The oil discovery that jump-started Texas' transformation into a major petroleum producer and industrial power was Spindletop. Exploration in the area of the upper Gulf Coast near Beaumont had begun in 1892. After drilling several dry holes, Louisiana mining engineer and oil prospector Capt. Anthony F. Lucas drilled the discovery well of the Spindletop field. Initially, the Lucas No. 1 produced more than an estimated 75,000 barrels of oil a day. Peak annual production was 17.5 million barrels in 1902.
Spindletop, which was also the first salt-dome oil discovery, triggered a flood of speculation in the area, resulting in several other significant discoveries. Within three years, several additional major fields were developed within a 150-mile radius of Spindletop; Sour Lake, Batson and Humble were among them. Companies were soon established to develop the Gulf Coast oil fields. Many of them became the industry giants of today: Gulf Oil; Sun Oil Company; Magnolia Petroleum Company; the Texas Company; and Humble Oil, which later affiliated with Standard Oil of New Jersey and became Esso, then today's Exxon. Refineries, pipelines and export facilities became the nucleus of the major industrial region that began to form along the Texas coast around Port Arthur and Beaumont. The New Handbook of Texas summarizes the effect of Spindletop in this way: "The discovery of the Spindletop oil field had an almost incalculable effect on world history, as well as Texas history. Eager to find similar deposits, investors spent billions of dollars throughout the Lone Star State in search of oil and natural gas. The cheap fuel they found helped to revolutionize American transportation and industry."
Texas oil production was 836,039 barrels in 1900. In 1902, Spindletop alone produced more than 17 million barrels, or 94 percent of the state's production. As a result of the glut, oil prices dropped to an all-time low of 3 cents a barrel, while water in some boom towns sold for 5 cents a cup.
North Texas - Between 1902 and 1910, oil fever spread through North Central Texas, with finds at Brownwood, Petrolia and Wichita Falls. Water-well drillers on the W.T. Waggoner Ranch in Wichita County in 1911 found oil instead, creating the Electra field. In 1917, W.K. Gordon, general manager of the T&P Coal Company's mines at Thurber, discovered the Ranger field nearby. Ironically, the wealth of oil at Ranger, and elsewhere in the state, encouraged railroads to switch their locomotives from coal to oil and helped kill the coal-mining town of Thurber.
Oil was found west of Burkburnett in Wichita County in 1912, followed by another oil field in the town itself in 1918. During the 1920s, there were discoveries near Mexia in Limestone County and more in Navarro County. Oil was discovered in the Panhandle starting in 1921, and major fields were developed all across the state during the next decade – East Texas, west-central Texas and additional fields in the Gulf Coast.
East Texas - In October 1930, the Daisy Bradford No. 3 well blew in near Turnertown and Joinerville in Rusk County, opening the East Texas field, the biggest field of all. Veteran wildcatter C.M. (Dad) Joiner drilled the well on land long rejected by major companies' geologists as not worthy of their efforts. The biggest leasing campaign in history ensued, and the activity spread to include Kilgore, Longview and many points north. Overproduction soon followed, as oil derricks sprouted thick as bamboo all over the field. With no well-spacing regulations and no limits on production, the price of oil nosedived again.
On Aug. 17, 1931, Gov. Ross S. Sterling ordered the National Guard into the East Texas field, which he placed under martial law. This drastic action was taken after the Texas Railroad Commission had been enjoined from enforcing production restrictions. After more than two years of legal battles, most East Texas operators accepted proration, the system of regulation still utilized. By the time the East Texas field was developed, Texas' economy was powered not by agriculture any longer, but by petroleum.9 Texas’ production peaked in 1972 at more than 1.2 billion barrels per year. Current production is about 390 million barrels per year and continues to decline despite increased exploratory drilling in recent years.
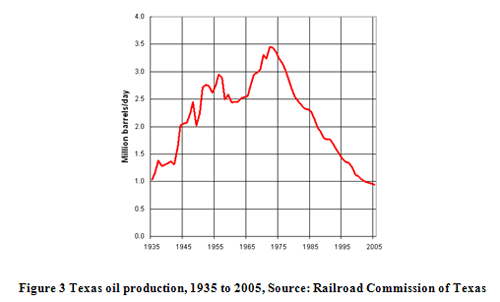
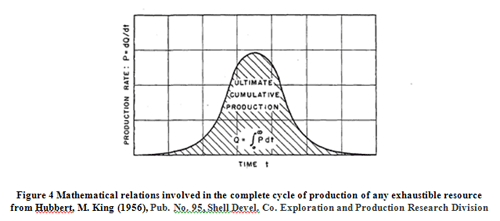
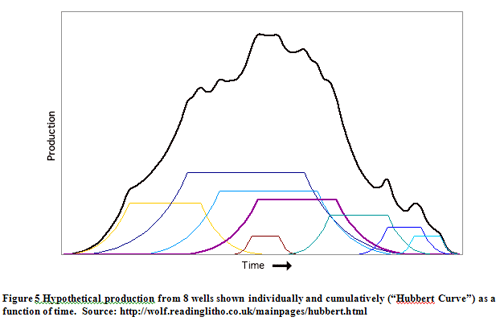
This production history exemplifies concepts developed by Marion King Hubbert, geophysicist extraordinaire. Beginning in the 1930’s, Hubbert was among the first to give serious thought to the issue of limits to production of non-renewable resources, especially fossil fuels. In his landmark article “Energy from Fossil Fuels” in the February 4, 1949 issue of the journal Science, Hubbert, then the Associate Director of the Exploration and Production Research Division of the Shell Oil Company, laid out a conceptual-mathematical framework to depict production of non-renewable resources centered around typical patterns of production as a function of time. Figures 2 and 3 show hypothetical examples of such “Hubbert Curves.”
What else can such a curve tell us? Through a process called Hubbert linearization, annual production divided by cumulative production can be viewed as a function of cumulative production to estimate total production when annual production reaches zero, in other words, what the total production will have been when the recoverable resource is exhausted. Many caveats are appropriate, particularly in cases such as Texas, in which rates of production of the resource are controlled for a time by policy rather than physical limits. In nearly all historic cases, however, the response to declining production is an heroic but futile effort to maintain the highest possible levels of production. Given this, the data tend to “settle down” to a trend that is quite useful as shown in Figure 4. Note that because of the acute angle at which the line of linear regression intersects the X axis (Q – total reasonably recoverable oil), small changes in slope can produce substantially different results for QT, the estimated ultimately recovered total. In fact, the last three years of data in Figure 3 suggest that an argument could be made for a slope of the line that is slightly less steep, with the result that QT might more appropriately be in the range of 65 billion barrels rather than 63. For the purposes of most analyses, however, a difference of that magnitude – perhaps 6 percent of the world’s annual production – is unimportant.
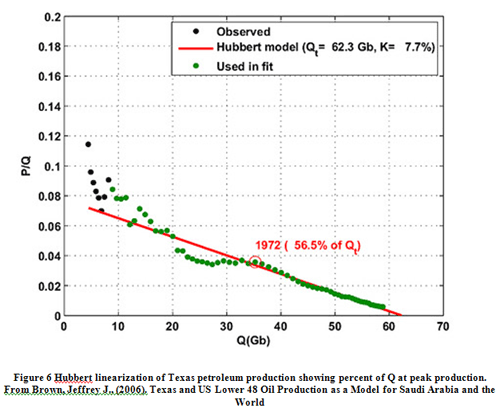
Also of interest is the percent of the estimated ultimate production that had been produced at the time of peak production. The Hubbert Curve as applied to production from large areas such as states, countries, continents, or the world, is fairly symmetrical which, if true would suggest that peak production should occur at 50 percent of ultimate production. In Texas’ case, it may have occurred at 56 percent, although if ultimate production is larger as suggested above, it may indeed be closer to 50 percent.
Oklahoma
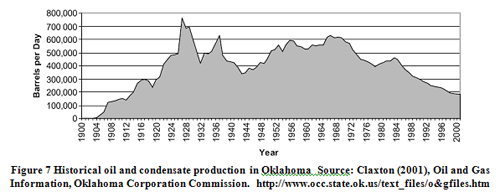
Oil seeps were recognized in Oklahoma long before the arrival of European settlers, who mined some seeps for asphalt. The first subsurface oil was recovered by accident, in 1859, in a well drilled for salt near present-day Salina (in Mayes County); its small amount of oil was sold for use in lamps. The first intentional oil find came from a well drilled in 1889 in an area of seeps near Chelsea (Rogers County); the well produced a half barrel of oil per day, used as “dip oil” to treat cattle for ticks (Franks, 1980). The first commercial paying well, the Nellie Johnstone No. 1, was drilled in 1896 near Bartlesville (Washington County). Completed in 1897 as the discovery well for the giant Bartlesville-Dewey Field, the well ushered in the oil era for Oklahoma Territory. Production there and in other areas rose rapidly thereafter, adding much impetus towards the granting of Statehood in 1907. In the 10 years between the first discovery well and Statehood, Oklahoma became the largest oil-producing entity in the world.
After the turn of the century, discoveries were made in rapid succession in areas that would eventually encompass many of the 26 major oil fields. All but five of the majors were discovered before the end of World War II; the last of them, the Postle Field, was found in Texas County in 1958. Although the 26 majors constitute only about 1% of the total number of fields, they account for 59% of the total oil produced (Lay, 2001). The largest 163 fields, representing 5 percent of total Oklahoma fields, have been responsible for 86 percent of total production. Until overtaken by California in 1923, Oklahoma remained the leading producing state in the U.S. (Hinton, 2001). Peak annual production of 278 million barrels was reached in 1927, with several intermediate highs and lows since then. The peaks and valleys result from changes in the number of wells drilled and completed as well as from the size of the fields being found.10 Today, Oklahoma’s annual production is 62 million barrels and declining.
California
Many people may be surprised to learn that one of Southern California's chief exports over the last 100 years, besides motion pictures, has been oil. Like oil reservoirs in Texas, Louisiana, and Pennsylvania, a hint of what lay beneath the surface could be seen in the many above ground oil seeps. These seeps had been known by Native Americans for thousands of years. In 1543, Spanish explorer Juan Cabrillo noticed the native people using the naturally occurring tar, or "pitch", to waterproof their canoes. These seeps were also responsible for the tar pits of La Brea (Spanish for "pitch"), which had, over many thousands of years, trapped unsuspecting animals and their predators looking for an easy meal.
In 1865, only 6 years after "Colonel" Edwin Drake's monumental discovery in Pennsylvania, California's first productive well was drilled by the Union Matolle Company in California's Central Valley. This area, east of San Francisco, became the scene of much of the drilling activity through the rest of the 1800's. While none of these wells were considered major strikes, they did provide enough oil for the nearby market of San Francisco, by far the largest population center in California in the late 1800's.
But the largest fields lay undiscovered near Los Angeles. The first well to strike oil in Southern California was drilled in 1892 by Edward L. Doheny, an unsuccessful gold and silver prospector, and Charles A. Canfield, his old mining partner. According to legend, Edward L. Doheny was in the downtown area of Los Angeles when he saw a cart whose wheels were coated in tar. When he asked the man where the substance had come from, he pointed to the northeast. Doheny and Canfield examined the area and soon discovered the Los Angeles Field after drilling to a depth of 140 meters (460 feet) at the corner of Colton Street and Glendale Boulevard, near present day Dodger Stadium. It was drilled using the sharpened end of a eucalyptus tree. Within 2 years of the find, 80 wells were producing oil in the area bounded by Figueroa, First, Union and Temple Streets. By 1897, the number of wells increased to 500.
Doheny eventually became a millionaire and challenged for the Democratic nomination for Vice-President of the United States in 1920. And although he was cleared of any wrong-doing, he later become a central figure in the Teapot Dome Scandal of the 1920's which brought disgrace to the presidency of Warren G. Harding. Not surprisingly, oil was at the center of the scandal. A local music teacher, Emma Summers, was one of the most successful investors in the first years of the initial boom, and by 1900, Summers controlled half the production in the original Los Angeles Field.and became known as "California's Petroleum Queen." The population of the city of Los Angeles doubled between 1890 and 1900, then tripled again between 1900 and 1910. Later, wells in the 1930's and 40's were soundproofed with vinyl-coated glass cloth with one-inch sheet fiberglass filling to decrease the noise, as the drilling activity began to conflict with the exploding Los Angeles population. Camouflage was also used, a technique that was eventually moved to offshore fields as well.
In 1900, the state of California produced 4 million barrels. In 1910, this had jumped to 77 million barrels. In spite of this increased production, many of the fields were beginning to see slowdowns in their production rates in the late 1910's, and California's wondered if their oil boom was reaching an end. Then, three major fields were discovered in rapid succession - Huntington Beach (1920), Santa Fe Springs (1921), and the biggest of them all, the Signal Hill, or Long Beach, Field in 1921. Signal Hill rises 365 feet behind Long Beach, 20 miles south of Los Angeles. Oil men first started exploring the area in 1916 after the successes of other ventures in southern California. In 1921, Dr. W. Van Holst Pellekaan, Chief geologist for Shell, tried to stop the drilling at Signal Hill, unconvinced of its potential. He was too late, however, and the drilling proceeded. Shell's reluctance to drill Signal Hill was understandable. The company had spent three million dollars at Ventura in the previous 5 years, and had no oil to show for it. And only 4 years before, Union Oil had drilled an unsuccessful well on Signal Hill. But it was ultimately the tenacity of geologists with Shell that moved the project forward.
On June 23rd at 9:30 PM, the Alamitos #1 erupted with so great a gas pressure that oil gushed over 100 feet into the air. On June 25, 1921, the well was producing more than 1,000 barrels of oil per day, and would eventually produce 700,000 barrels of oil.
The discovery created a stampede. While the well was being drilled, the area was in the process of being subdivided into residential lots. Many of the lots, though already sold to prospective homeowners, were not yet built upon, and potential homeowners quickly changed their minds and entered the business of looking for oil, hoping to get rich quick. The parcels of land were so small and the forest of tall wooden derricks so thick that the legs of many of them actually intertwined. Oil promoters were selling shares of wells that had not yet been drilled. Signal Hill was to prove so prolific that, almost unbelievably, many of those buyers actually made money on their investments. The next-of-kin of persons buried in the Sunnyside Cemetery on Willow Street would eventually receive royalty checks for oil drawn out from beneath family grave plots.
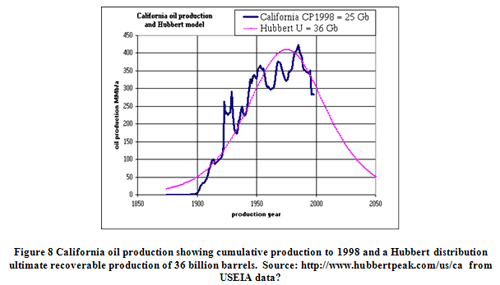
By April 1922, only 10 months after completion of the discovery well, Signal Hill was covered with 108 wells, producing 14,000 barrels daily. By the fall of 1923, 259,000 barrels of crude was being produced every day from nearly 300 wells. Signal Hill was the biggest field the already productive Southern California region had ever seen. In 1923, Signal Hill produced 244,000 barrels, alongside Huntington Beach (discovered in 1920) at 113,000 and Santa Fe (1921) at 32,000. This made California the nation's number-one producing state, and in 1923, California was the source of one-quarter of the world's entire output of oil. By the end of 1938, the Long Beach Field had produced 614.5 million barrels of crude, 750 million barrels by 1950, and over 900 million barrels by 1980. This made Signal Hill one of the most productive fields per acre the world has ever known.11 More recently, however, the state’s production peaked in 1985 at 424 million barrels and has continued to decline, with Kern County now the site of about 75 percent of its production. California’s current annual production is 223 million barrels. This is insufficient to meet the state’s own needs, and a new petroleum import terminal is now scheduled for construction at the Port of Los Angeles to maintain feed for local refineries.
Lower 48 Summary
M. King Hubbert’s landmark paper “Nuclear Energy and the Fossil Fuels,” presented before the Spring Meeting of the Southern District, Division of Production, American Petroleum Institute in San Antonio, Texas in March 1956, and later published as Publication No. 95 of the
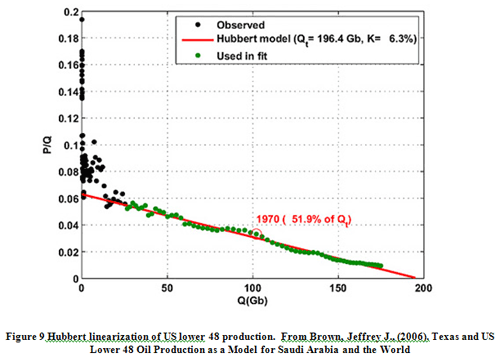
Shell Development Company’s Exploration and Production Research Division in June 1956, used concepts discussed here to predict the timing of the United States lower 48 reaching peak petroleum production and to suggest the amount of ultimately recoverable petroleum. Hubbert’s analysis concluded that peak production would be reached between 1966 and 1971. Actual peak lower 48 production occurred in October-November 1970. Figure 9 is a more recent linearization of lower 48 production that suggests that the ultimately recoverable petroleum resource will be just under 200 billion barrels and that peak production occurred at about 52 percent of total ultimate production.
Alaska
Alaskan oil production was relatively insignificant prior to the 1970’s, and was centered mainly in southern parts of the state. But in the early 1970s, as petroleum production from the Lower 48 states declined, a new discovery of oil at Prudhoe Bay on the North Slope of Alaska offered the U.S. the promise of a significant new source of competitive domestic supply on a world class scale. The discovery was initially estimated to be 9.6 billion barrels of oil, nearly double the size of the largest field ever previously found in North America. Despite high costs, hostile climate, untested technology, unsettled land claim issues, and major environmental challenges, supply from Prudhoe Bay came online in 1977, offsetting most of the decline in Lower 48 supply through the mid-1980s.
By the mid 1980s, the Alaskan North Slope was supplying about a quarter of U.S. oil production. Operations in the area led to a series of other discoveries in the vicinity of the initial discovery, several of which also rank among the largest in North America, and which themselves gave rise to a sequence of new development. Cost reductions and the availability of pre-existing North Slope infrastructure has reduced the minimum size at which a new field is economic to develop, leading to new developments drawn from the inventory of smaller satellite fields identified in the process of developing the major discoveries. The ongoing development effort, combined with the increasing availability of pipeline capacity as Prudhoe Bay production declines, stimulated interest in three adjacent areas also thought to contain major resource potential – the Arctic National Wildlife Refuge (ANWR) to the East, the National Petroleum Reserve – Alaska (NPR-A) to the West, and the offshore areas to the North.
However, the current realities of North Slope development have been falling increasingly short of this potential. Prudhoe Bay production peaked in 1987 and overall North Slope production exceeded 600 million barrels only briefly in 1988 as shown in Figure 10.
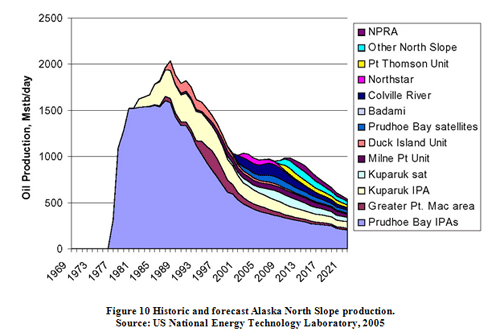
By 1998, production had fallen by nearly 40 percent,12 and by 2005 output had fallen nearly 75 percent from its peak and is expected to continue dropping.13 Alaska’s statewide 2006 annual production of crude oil totaled about 270 million barrels.
I can’t move beyond Alaska without comment on the controversy over proposed development of the Artic National Wildlife Refuge east of Prudhoe Bay. The resource has been described by the US Geological Survey as a 95 percent probability of 4.3 billion barrels, and a 5 percent probablility of 11.8 billion barrels of technically recoverable oil in the Arctic National Wildlife Refuge 1002 area, with a mean value of 7.7 billion barrels. In addition, in the entire assessment area, which covers not only land under Federal jurisdiction, but also Native lands and adjacent State waters within three miles, technically recoverable oil is estimated at a 95 percent probability of 5.7 billion barrels and a 5 percent probability of 16.0 billion barrels (0.7 to 1.9 km³), with a mean value of 10.4 billion barrels (1.2 km³). It’s not entirely clear how such probablistic representations of the resource should be treated. Advocates of near-term drilling and production from ANWR typically use the mean value on which to base their arguments, whereas in my view if the US is truly counting on the availability of these resources it would be well served to plan on the basis of considerably higher confidence levels. Advocates of exploitation of ANWR suggest that the area as a whole could supply 5 percent of the nation’s demand for oil for 30 years and opponents suggest that at best it could provide the nation’s entire supply for about one year. Neither is entirely true; in fact, the likely production pattern would be similar to that of Prudhoe Bay, although the dispersed nature of the ANWR area resource suggests that peak production would be somewhat lower than Prudhoe’s peak and the post-peak decline might be more extended. In any case, petroleum prices are controlled by worldwide supply-demand relationships, and the fact that ANWR would be unlikely at any time to comprise even two percent of world production suggests that it would have little impact on world petroleum prices.
Offshore Federal Leases
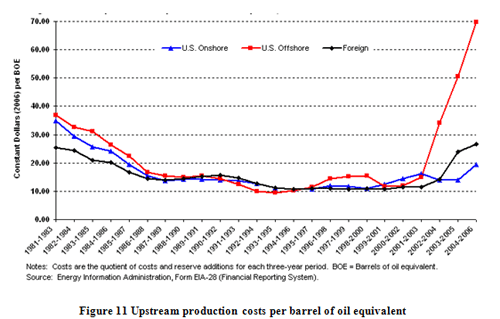
Surprisingly, offshore federal leases, mostly in the Gulf of Mexico but also off the coast of California, are now the largest source of domestic crude oil, supplying about 25 percent of the nation’s natural gas production and about 24 percent of its oil production. Early offshore drilling was limited to areas where the water was less than 300 feet in depth, but no longer; drilling rigs can now operate in water as much as two miles deep. Some drilling platforms stand on stilt-like legs that are imbedded in the ocean floor, but floating platforms are used for drilling in deeper waters, anchored to the ocean bottom with huge cables. Once the wells have been drilled from these platforms, the production equipment is lowered to the ocean floor and sealed to prevent leakage. Wells have been drilled in 10,000 feet of water using these floating rigs. Offshore production is many times as expensive as land-based production (Figure 11).
The tremendous escalation in offshore costs is attributed to escalating prices for drilling rigs, offshore installation vessels, equipment (compressors, generators), shipyards, fabrication, qualified personnel, and technology limits.15 Virtually all existing leasing and development activity occurs in the central and western Gulf of Mexico. There, more than 4,000 platforms are operating in waters up to 6,000 feet deep, and many rigs are drilling in waters approaching 10,000 feet. Right now most of the active wells and proven reserves are in the Gulf of Mexico. There are also 43 wells off California.14 Federal plus state annual offshore production is now just under 500 million barrels.
Total US Production
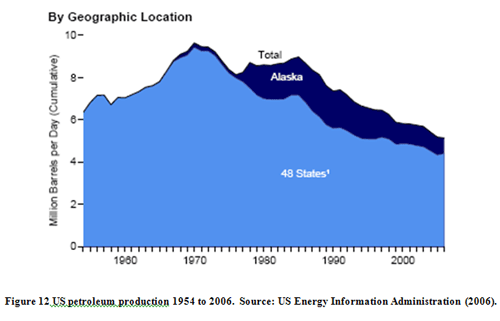
Figure 12 shows total United States petroleum production over time. As noted previously, the more recent Alaskan production added significantly, but could not return production to levels seen prior to the principal 1970 peak.
It has been suggested that the seemingly inexorable decline in domestic production is linked to increasingly stringent environmental regulations that prevent drilling the number of wells needed to maintain or even increase production.
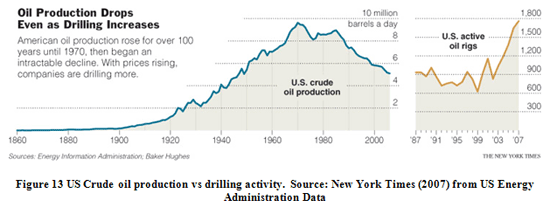
As can be seen from Figure 13, the data show this to be incorrect.
The Rest of the World
Let’s now turn to a few of the giants beyond our borders that are, of have recently been, the “swing producers,” that is, fields whose production is so great as to have a controlling influence on world oil prices just as Texas did 60 and more years ago. The following is not intended to be exhaustive, and does not include discussion of some very significant fields. Notable among those are Samotlor, Russia’s largest field, a 20 billion barrel field discovered in 1965 that produced almost 3.5 million barrels per day as of 198319 but dropped below 500,000 after attempts to maintain production by injecting water into the field resulted in water mixing with the remaining oil. Another is Daqing, China, the world’s fourth largest, a 16 billion barrel field discovered in 1959 of which less than 4 billion barrels remain.20
The Ghawar Oil Field, Saudi Arabia
The Ghawar Oil Field is the largest of the five “supergiant” Saudi fields discovered between 1940 and 1965.21 It is by far the largest conventional oil field in the world and accounts for more than half of the cumulative oil production of Saudi Arabia. Although it is a single field, it is divided into six areas (from north to south, they are Fazran, Ain Dar, Shedgum, Uthmaniyah, Haradh and Hawiyah). Although Arab-C, Hanifa and Fadhili reservoirs are also present in parts of the field, the Arab-D reservoir accounts for nearly all of the reserves and production.
The Ghawar Field was discovered in 1948. Production began in 1951 and reached a peak of 5.7 million barrels per day in 1981. This is the highest sustained oil production rate achieved by any single oil field in world history. At the time that this record was achieved, the southern areas of Hawiyah and Haradh had not yet been fully developed. Production was restrained after 1981 for market reasons, but Ghawar remained the most important oil field in the world. The production of the Samotlor Field in Russia was greater during the mid-eighties, but this was because production at Ghawar was restrained. Development of the southern areas during 1994 to 1996 allowed production from the Ghawar Field to exceed 5 million barrels per day once again, more than Samotlor ever produced.
This remarkable production history is because of the enormous size of the Arab-D reservoir in the Ghawar Field. The productive area of the Ghawar Field exceeds 1000 square miles.16 This represents a single, pressure-continuous reservoir. Cumulative production by the end of year 2000 was about 51 billion barrels of oil, or about 5 percent of total world historic production.
The anhydrite in the Upper Arab-D forms the seal for the 1,300-foot oil column in Ghawar. It is composed of evaporites with thin carbonate interbeds that can be traced for hundreds of kilometers. In the uppermost part of the Arab-D are occasional zones that contain more than 10% fossil sponges which, where converted to dolomite during diagenesis, creates zones of super-permeability, where almost no resistance to fluid flow exists.
The source rock for the Ghawar oil is believed to be the Tuwaiq Mountain Formation, which underlies the Hanifa. It reaches a thickness of more than 300 feet in the basinal area between the Ghawar and Khurais Fields. That this moderate volume of source rock should produce the largest accumulation of light oil in the world indicates very efficient migration and entrapment. The fact that the Ghawar oil-water contact is substantially higher on the west flank than on the east indicates a hydrodynamic gradient to the east, which may explain the much larger volume of oil in Ghawar than in Khurais.
A peripheral water injection project began in the early sixties in the northern parts of the field. By the time that the southern Hawiyah and Haradh areas were developed during 1994 to 1996, horizontal-drilling technology was available. Horizontal injectors were completed above the tar mat to provide line source distribution of water along the periphery of the field.
This water injection, while keeping field pressure high, has also caused the “water cut,” the fraction water in the total liquid lifted from the wells, to be so high as to depress production of actual oil. It is now consistently exceeding 30 percent There is rising concern that high water volumes could ultimately force at least temporary abandonment of areas of the field, bypassing petroleum that would otherwise have been recoverable under more conservative field management techniques and leading to precipitous production declines.22
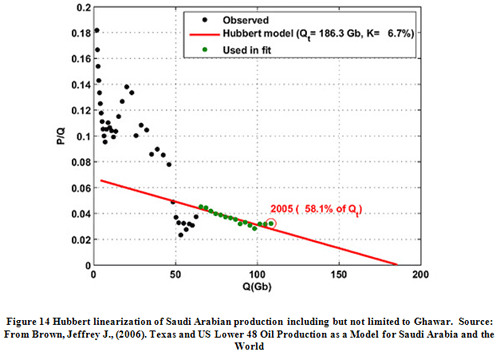
The linearization in Figure 14 suggests an estimated ultimate Saudi production slightly under 200 billion barrels, and that more than half of that total has been produced already. Of this total, Ghawar is believed to have had initial reserves of between 97 and 115 billion barrels, of which between 62 and 72 million barrels had been produced as of 2006.28
It is interesting to compare the estimated ultimate total Saudi production with remaining reserve estimates that jumped from 108 billion barrels to 169 billion barrels in 1979, and then to 255 billion barrels in 1988. These jumps appeared to coincide with decisions by OPEC to impose production quotas that were calculated as a percentage of reported reserves, rather than any particularly significant discoveries.22,23 Note also that, as will be discussed later, Saudi Arabia is counted on by the United States Energy Information Administration of the US Department of Energy to have the surplus production capacity to greatly increase worldwide production to meet the demands of the decades to come. The above analysis strongly suggests that instead, near-term irreversible declines in Saudi production should be expected.
Burgan Field, Kuwait
Kuwait’s Burgan Oilfield was discovered in February 1938 and the US and British-owned Gulf Oil Corporation began commercial oil production in 1946. Burgan was one of the world's easiest production sites; primary recovery methods were adequate to maintain high production levels for decades. It was developed rapidly and production first reached one million barrels per day in 1955 and two million by 1968. From 1949 to 1972 when production peaked at 2.41 million barrels per day, Burgan was the world’s most productive oilfield, after which it was surpassed by Ghawar. Burgan accounted for more than half of Kuwait's proven oil reserves.
In 1991, retreating Iraqi soldiers set Burgan Field on fire. Smoke plumes from the Greater Burgan oil field extended 50 kilometers in width on any given day, and 2.5 km thick. From satellite observations the plume appeared like a black snake in the desert that extended parallel to the Persian Gulf (EOS Project NASA Goddard Space Flight Center). The Red Adair Service and Marine Company extinguished 117 of the burning oilwell fires. Declassified 1991 USA CIA documents showed that despite the destruction there was no significant depletion of the oil reserves and production capacity of Burgan field. Most of Burgan Field was rebuilt, but three gathering stations were too badly damaged to repair and remained as unofficial monuments to the destruction.17 In November 2005, Farouk Al Zanki, Chairman of state-owned Kuwait Oil, reported that the Burgan oil field production levels are running down, and that Burgan will now produce 1.7 million barrels per day rather than 2 million for the rest of its 30 to 40 years. He said that engineers had tried to maintain 1.9 million barrels per day but that 1.7 million is the optimum rate. As of late 2005, Kuwait as a whole was pumping 2.5 million barrels a day, equivalent to 3 percent of global demand, down from a peak of almost 3 million barrels a day in 1972.18

Issues similar to Saudi Arabia’s pertain to Kuwait as well. Reuters News Service published the following about a little-read Petroleum Intelligence Weekly story: "PIW learns from sources that Kuwait's actual oil reserves, which are officially stated at around 99 billion barrels, or close to 10 percent of the global total, are a good deal lower, according to internal Kuwaiti records… according to data circulated in Kuwait Oil Co (KOC), the upstream arm of state Kuwait Petroleum Corporation, Kuwait's remaining proven and non-proven oil reserves are about 48 billion barrels.
Officials from KOC were not immediately available for comment to Reuters. PIW said the official public Kuwaiti figures do not distinguish between proven, probable and possible reserves. But it said the data it had seen show that of the current remaining 48 billion barrels of proven and non-proven reserves, only about 24 billion barrels are so far fully proven -- 15 billion in its biggest oilfield Burgan.” In Figure 11, the messy data do not support a clear answer (only data points in purple are used to define the linearization), but the intercept is at 76 billion barrels. Cumulative production to date is approaching 38 billion, so that Kuwait’s cumulative production may now be very close to 50 percent of its total readily recoverable petroleum resource.
Cantarell, Mexico
Mexico’s Cantarell Field is the largest in Mexico. It was discovered in 1976 by a fisherman, Rudesindo Cantarell, about 50 miles offshore in the Bay of Campeche. This complex comprises four major fields: Akal (by far the largest), Nohoch, Chac and Kutz. The reservoirs are formed from carbonate breccia of Upper Cretaceous age, the rubble from the asteroid impact that created the Chicxulub Crater. Within five years of the initial discovery, the Cantarell complex was producing 1.16 million barrels per day. However, the production rate dropped to 1 million barrels per day in 1995. A nitrogen injection project started operating in 2000, and it increased the production rate to 1.6 million barrels per day, to 1.9 million barrels per day in 2002, and to 2.1 million barrels per day in 2003, which ranked Cantarell as the second fastest producing oil field in the world behind Ghawar. The nitrogen for the nitrogen injection process is supplied by the largest nitrogen production plant in the world.
Luis Ramírez Corzo, head of PEMEX's exploration and production division, announced on August 12, 2004 that the actual oil output from Cantarell is forecast to decline steeply from 2006 onwards, at a rate of 14% per year. In March 2006 it was reported that Cantarell had actually peaked in 2004, with a second year of declining production in 2005. For 2006, the field's output declined by 13.1%, according to Jesús Reyes Heróles, the director-general of PEMEX. Reyes Heroles told Reuters in February 2008 that average daily production at Cantarell, in the Gulf of Mexico, would drop by 200,000 barrels over 2008, increasing pressure on the state-owned oil monopoly to ramp up output at smaller fields. The decrease would be a drop of 16% from Cantarell's December 2007 output of 1.26 million barrels per day, its lowest level of the year. Yields at Cantarell declined 16% during 2007, slightly more than forecast. This rapid decline is postulated to be a result of production enhancement techniques causing faster oil extraction at the expense of field longevity.
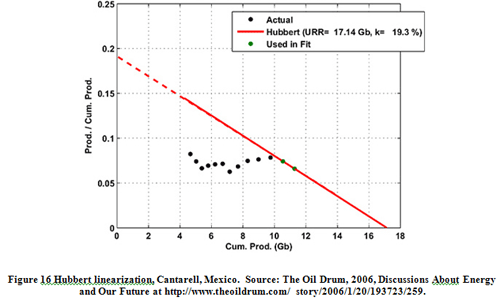
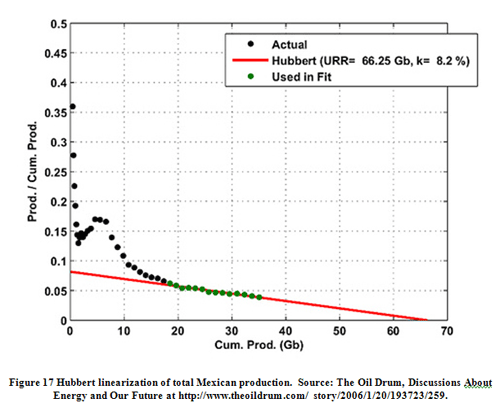
Figures 16 and 17 from The Oil Drum appear credible although reliance on only two points for linearization of Cantarell production (because of the very recent precipitous production declines) calls for caution. The data show why Cantarell has been called “the Ghawar of Mexico,” because it contains fully one fourth of Mexico’s estimated ultimate recoverable resource. Mexican production as a whole peaked with Cantarell in 2004 at very close to 50 percent of estimated ultimate production.
Other Countries and the Major Oil Companies
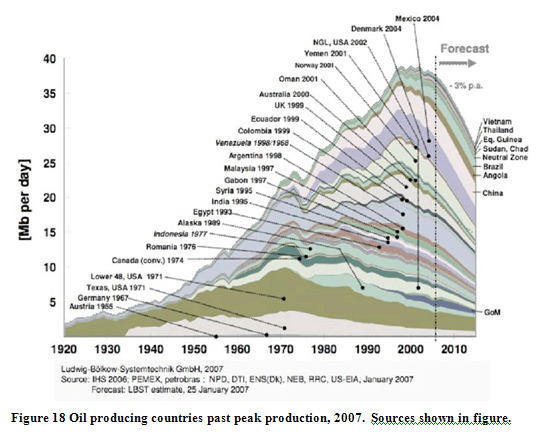
As is suggested by the sampling of case studies above, production from most countries of the world has peaked and maintenance of worldwide production levels rests with the fates of a giant fields. These post-peak countries, their production histories, and dates of peak production are shown in Figure 18.
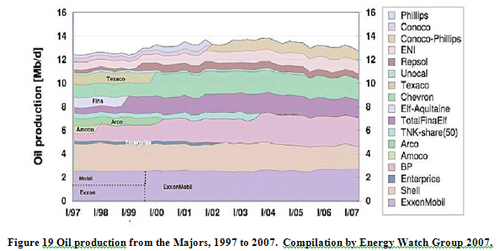
The giant fields such as Ghawar that are responsible for maintenance of world production levels are increasingly controlled by national oil companies rather than the privately held “Majors” as shown in Figure 19. Plainly apparent is that nearly all increases in corporate production during the last decade have occurred through acquisition of other companies’ reserves rather than new discoveries.
Rates of Discovery and Production
From Figure 20 it can be seen that the world’s largest oilfields were discovered in the 1930’s and 1940’s, and that rates of discovery remained higher than worldwide demand into the 1980’s
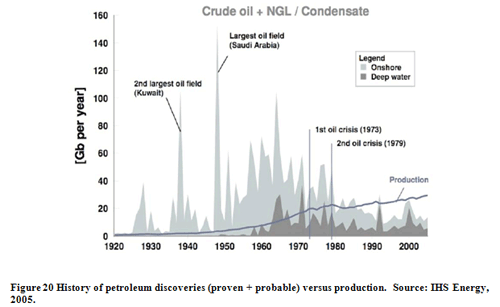
However, for the past 22 years, demand and production have outstripped discovery, as suggested in the Chevron advertisement shown in Figure 21.
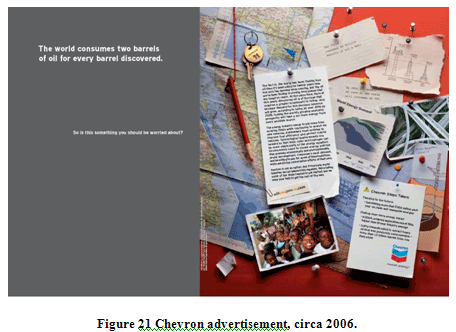
Now, the world is now consuming more than 30 billion barrels each year for each seven to eight billion added through discovery, a three or four-to-one ratio. Of the new discoveries, about half consist of deep water, high cost resources. Our consumption is supported by the successes of the past.
The nature of petroleum exploration itself seems to be a mystery to most laymen. Back in the 1940’s and earlier, Hubbert and others inventoried both the continents and continental shelves for rocks of the age and composition that would identify them as potential sources of oil.25 Even then, this information was reasonably well known. Extrapolation of the ratio of oil volume to total potential hostrock in well-explored areas of the United States, to worldwide volumes of potential hostrock, was the basis for a calculation by Hubbert that the reasonably recoverable worldwide conventional petroleum resource would total slightly more than 2 trillion barrels, a number fairly consistent with 95 percent confidence level figures published more than 50 years later by the United States Geological Survey. This also provides insight into the nature of today’s exploration; the romantic notion of wildcatting in “unexplored’ territory is a thing of the distant past. When an oil company broadcasts the success of a test well in the deep waters of the Gulf of Mexico as occurred a year ago, it represents a statement of relief that the expenditure of tens of millions of dollars in that well and the multimillion dollar exploration program the preceded it were justified; the hole would never have been drilled had the area not already been identified as part of the hoped-for resource by workers like Hubbert years or decades earlier. In short, the potential for unexpected world-class discoveries anywhere in the world now is very low.
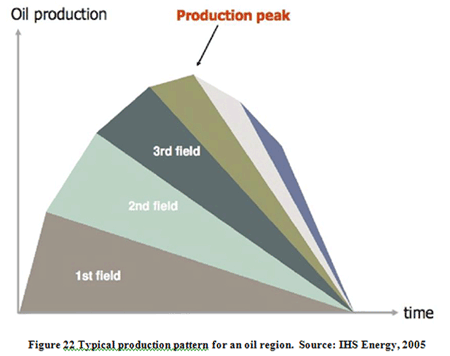
From the production histories of numerous now-mature fields (for example, the Alaska North Slope), one can generalize about typical patterns of production from a multi-field region (Figure 22). Among the observations are that individual fields within a region are usually discovered and almost always put into production in order of size. The reason is not merely that the “elephants” are more easily discovered than the lesser resources, it is also that the “elephants” are capable to higher rates of peak production and therefore provide a more rapid return on the large initial investment required to bring a field online. Once the large field(s) have amortized the exploration, development, and infrastructure support costs, the paid-for regional infrastructure may be sufficient to render otherwise marginal resources economic to produce at later times. This pattern also explains why oil regions rarely experience great production renaissances; once production has peaked, usually when about half the total recoverable petroleum resource has been extracted, production can vary but declines are rarely reversed through later development of the small fields.
Alternative sources – tar sands, oil shale
Most credible estimates of recoverable petroleum that exceed 3 trillion barrels do so by calling on production of many hundreds of billions of barrels from the tar sands of Athabaskan Alberta, Canada and elsewhere, as well as kerogenic shales (erroneously called oil shales) on the west slope of the Rocky Mountains. Both clearly represent major resources, but production from both sources are constrained by a number of factors.
Petroleum recovery from Canadian tar sands currently relies on cheap locally produced natural gas to provide the heat needed to extract usable oil from the viscous tars. The net energy gain associated with this process is very low and may be effectively zero. Further, the environmental impacts of what is, in effect, a strip mining operation on a grand scale are very severe. Finally, even if these factors could be overcome, the maximum rate of production from this source appears to be less than 3 million barrels per day (as compared to current daily worldwide demand of about 84 million barrels). In short, if extraction of petroleum from the tar sands can be powered instead by a renewable source such as hydroelectric or solar power, tar sands could be an important means to maintain a modest production of petroleum long after conventional resources are depleted. However, tar sands cannot maintain worldwide production levels as conventional production declines.
Oil shales on the west slope of the Rocky Mountains were extensively explored by both Exxon and Atlantic Richfield in the 1970s and early 1980s without establishing a feasible production technology. Work by Shell over the past 20 years on an in situ heating, however, has apparently achieved successful extraction at a 3.5 to 1 net energy gain.26,27 The technology is shown in Figure 23.
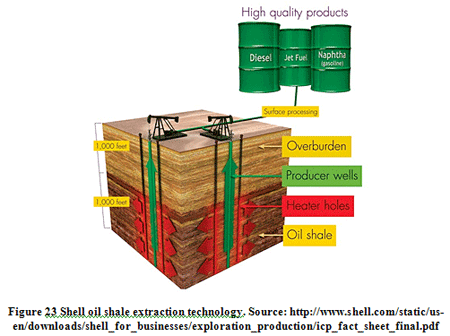
Not shown here is a key element of the technology – formation of an impermeable ice wall around the perimeter of the source rock that prevents the escape of the gas and oil produced by in situ heating of the kerogen. After emplacement of the ice wall, ground water is pumped out so that the heating process affects only unsaturated rock. Unlike the earlier Exxon process that required open pit mining, this in situ process should minimize environmental impacts to the degree that it may be possible to apply it on a large scale to National Forest lands.
According to Shell, oil shale production by this innovative technology could reach 2 million barrels per day. Like the tars sands, then, oil shale could maintain a modest production after conventional resources are depleted, but will not maintain worldwide production levels as conventional production declines
Calculations of available conventional oil and forecasts
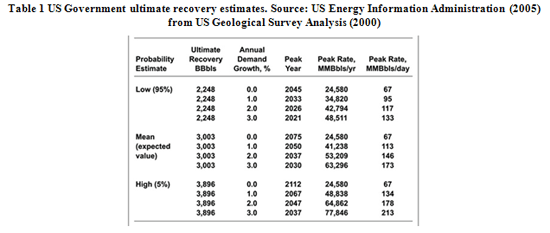
The United States Geological Survey’s estimate of recoverable petroleum was reference above and is shown in the column titled “ultimate recovery” of Table 1 below. The phrase “expected value” associated with the Mean Estimate is almost certainly the United States Energy Information Administration’s opinion rather than that of the Geological Survey; a 50 percent probability in this case means that the likelihood of the estimate being overly optimistic is 50 percent. Most of us wouldn’t bet the house on those odds.
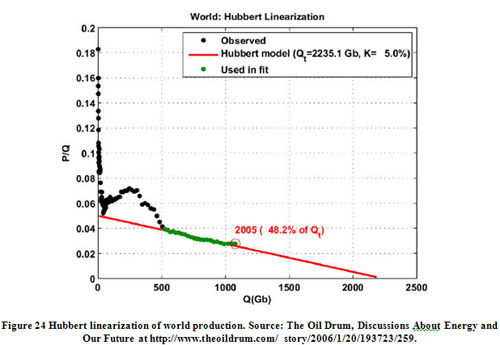
Hubbert linearization of historic production data gives a result remarkably (and probably fortuitously) similar to the US Geological Survey’s 95 percent confidence level estimate, 2.235 billion versus 2.248 billion barrels. The Geological Survey number was apparently based on the Survey’s Year 2000 World Petroleum Assessment, which upon reassessment in 2005 was shown to have overstated rates of new resource discovery. David Strahan, in the article “In Praise of the United States Geological Survey,” published in both the Geoscientist and the Petroleum Review in April 2007, wrote,
“the Survey produced two separate estimates: one was based on a geological appraisal of how much oil might be discovered during the forecast period; the other a calculation of how much supply could be expanded through ‘reserve growth’ - the tendency for known fields to yield more than originally expected as time goes on, through some combination of conservative initial estimates and technological improvements. The USGS concluded that reserve growth could add 612 billion barrels of crude oil by 2025, and discovery a further 649 billion barrels… The USGS [2005] self-assessment showed that their reserve growth forecast for crude oil was on track but their discovery forecast was badly adrift. One quarter of the way through the original forecast period… real-world oil discoveries were underperforming by almost 60 percent…Oil discovery is much more likely to keep on falling in line with its historical trend than to start rising again. But even if it were to remain steady at 9 billion barrels a year until 2030 – highly unlikely – the undershoot against the USGS forecast would still be almost 400 billion barrels (22 – 9 x 30 = 390), meaning that the USGS ‘ultimate’ for conventional oil should be reduced to 2,600 billion barrels at the very most.”
As noted above, 0.612 trillion of the 2.6 trillion barrels is from reserve growth, about which Strahan writes,
“In fact there is some reason to believe that reserve growth may also start to falter soon. Michael Rodgers, head of upstream economics at the respected international consultancy PFC Energy, notes that in deep water Gulf of Mexico the general experience over the last decade has been that companies’ initial reserve estimates have proved to be either accurate or overly optimistic. In other words, subsequent ‘reserve growth’ has either been nonexistent or negative - the fields have produced less than originally expected. As companies get better at reserve estimation, and as the average size of fields discovered continues to fall, Rodgers thinks this may become the norm: “I doubt we will see the reserve growth for fields discovered after 1990 that we had for those found earlier”.
This lack of reserve growth at levels comparable to those seen for older oilfields should be expected given the increasing sophistication and technologies in support of reserve estimation and strong disincentives to underestimate exploration potential given spiraling exploration costs. Further, it is illogical to extrapolate the reserve growth of the past even to older fields because of opportunities in recent years to apply better estimation techniques incorporating the abundance of production-level data available for them. From these considerations, a “reassessment of the reassessment” suggests that the original 95 percent figure, 2.2 to 2.3 trillion barrels of ultimately recoverable petroleum, looks quite credible. It is important to note that this range does not include substantial recovery from tar sands or oil shale as discussed above (higher US Geological Survey ranges do consider these non-conventional sources).
And how much have we recovered thus far from the 1800s to the present? IHS Energy (2007) estimated cumulative production to the end of 2006 at 1.10 trillion barrels. Worldwide production in 2007 was 30 billion barrels meaning that cumulative production to date is approximately 1.13 trillion barrels. Another Chevron advertisement shown in Figure 24 below suggests the petroleum industry would agree.

If an estimated ultimate conventional petroleum production of 2.2 to 2.3 trillion barrels is on target, the world in 2008 is almost exactly at 50 percent of ultimate estimated recovery, the point at which Hubbert’s analyses suggest that we should anticipate a peaking of production followed by irreversible decline.
Peaking scenarios
It is intriguing to compare three peaking scenarios offered by two branches of the United States Government and the Association for the Study of Peak Oil and Gas, a multinational Europe-based association of scientists from institutions and universities in Austria, Denmark, Finland, France, Germany, Ireland, Italy, Netherlands, Norway, Portugal, Spain, Sweden, Switzerland, and the United Kingdom (an American chapter has now been opened).
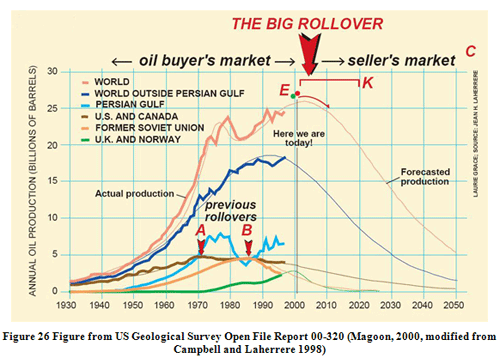
First, the United States Geological Survey published Open-File Report 00-320 (Magoon, 2000), a part of which is shown in Figure 25. Curiously, publication of this open file report was concurrent with publication of the Survey’s now-discredited world petroleum assessment described previously that suggested much higher levels of recoverable conventional petroleum than today’s evidence suggests, and therefore served as a basis to argue that peak production was still many years away.
A second scenario is provided by the Association for the Study of Peak Oil and Gas as shown in Figure 27. Note that the light and dark green bands in this figure are natural gas, not oil.
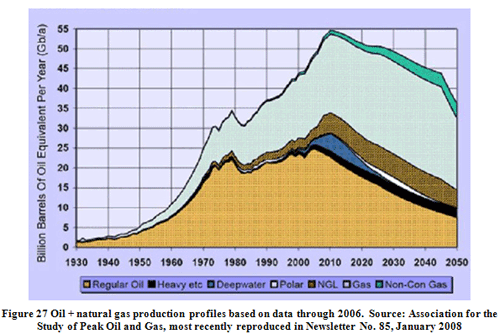
Although discussion of the status and future of natural gas production is beyond the scope of this paper, Figure 27 shows that combined worldwide petroleum and natural gas production, as measured in oil equivalents, is expected to peak concurrently with petroleum production.
A third and substantially different view is offered by the United States Energy Information Administration, the information and public outreach arm of the United States Department of Energy (Figure 28). As previously discussed, the “Low-95 %” scenario appears to be the most credible estimate of ultimately recoverable conventional petroleum among those offered in light of more recent reassessment by the Survey and others.
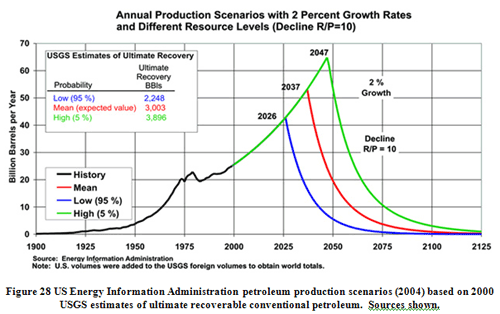
Two aspects of the USEIA curves are remarkable: first, although the area under the 2.248 trillion barrel curve (in blue) is actually smaller than the area under the ASPO curve for liquids only in Figure 27 (which totals 2.4 trillion barrels), production is nevertheless shown to climb to more than 40 billion barrels per year by 2026. The ASPO curve, by contrast, shows a peak production of about 31 billion and a peak around 2010. In short, by shaping the curve differently, the projected timing of peak production can be deferred and height of the peak can be increased for a resource of the same volume, although production in the USEIA scenario “pays” for the delayed peak and higher production with a catastrophic post-peak decline as compared to the US Geological Survey and ASPO scenarios.
As was the case with the peaking of US production in 1970, we won’t know when world production peaks until perhaps years later when the data trends become clear. However, choosing appropriately between these scenarios: peak worldwide petroleum production at today’s production levels (as suggested by the USGS and ASPO), versus as much as 18 years in the future at 10 billion barrels per year more (as suggested by the USEIA chart) – really matters. Based on experience gained in areas in which production has already peaked as discussed earlier, factors to consider in choosing between these alternatives are: 1) do recent production data show substantial continuing increases as would be suggested by the USEIA scenario, or do they appear to be on the sort of plateau one would expect at the top of the Hubbert Curve, and 2) is the shape of the curve consistent with peak production occurring at between 50 percent and 60 percent of ultimate production as has been noted in post-peak oil regions elsewhere in the world?
Worldwide production data from January 2001 through November 2007 are shown in Figure 29.
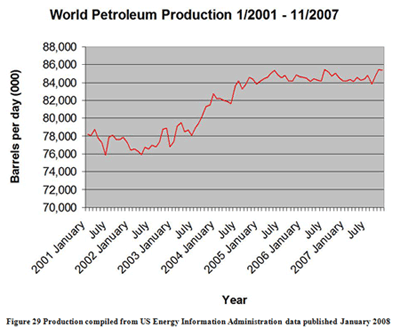
Figure 29 shows that daily worldwide petroleum production has been limited to a narrow range between 84 million and 85.5 million barrels per day since the latter half of 2004, the longest period of flat production in recent history. If this were a response to a lack of demand, one would expect price to be flat as well. However, as can be seen from Figure 30, petroleum prices have doubled in the time that petroleum production was flat, consistent with the concept that worldwide production is inelastic relative to commodity price.
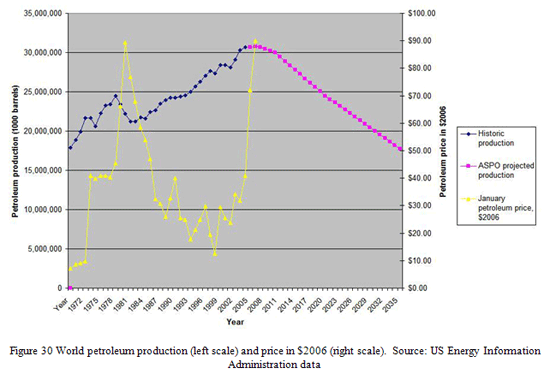
In summary, it appears that recent production history is much more consistent with the shape of the traditional Hubbert, US Geological Survey, and ASPO curves.
The second criterion is the timing of peak production in relation to cumulative production at the time of the peak; as shown in Hubbert linearizations discussed previously, peak production typically occurs when cumulative production is between 50 percent and about 56 percent of ultimate production. The USEIA curve in Figure 28, however, places the time of world peak production at more than 75 percent of ultimate production. No precedent exists for this among large producing regions of the world (Ghawar at nearly 60 percent may be the highest), nor does there appear to be any credible scientific or engineering basis for such a scenario.
A final dubious aspect of the USEIA curve is the indication that world production can and will increase by another 10 billion barrels per year, from about 30 billion in 2007 to more than 40 billion by 2026. To put this in perspective, it would take five Ghawars at peak historic production to produce an additional 10 billion barrels per year. However, even that wouldn’t be sufficient because declines in future production among most other historic producers over the next 18 years would also have to be offset. In short, what was the Energy Information Administration thinking? I leave the answer to that question and the choice of curves to you.
In summary, I offer quotes from a few notable individuals:
As of January 31, 2008, Dr Jim Buckee has just retired as President and CEO of Talisman Energy, a major independent Canadian oil company with a market capitalisation of $25 billion. Dr Buckee said on Australia Broadcasting Corporation radio that 'peak oil' was now either here, or very close: “It is the underlying decline of the world's major fields that is the dominant driving factor here. If you think that at the moment the world is consuming 30-plus billion barrels a year of oil and is finding seven or eight billion barrels a year. And this state of affairs has been going on now for 20 or more years. It's obviously unsustainable and the world is increasingly drawing on the bigger older fields. You couple that notion with the irreversibility of decline and you've got a very alarming picture.”
Matthew R. Simmons, is Chairman and Chief Executive Officer of Simmons & Company International, a Houston based firm that is one of the world’s largest investment bankers for the energy industry. In his whitepaper entitled “Another Nail in the Coffin of the Case Against Peak Oil” dated November 16, 2007, Simmons writes the following: “The world now has a front-row seat for the stark realization of Peak Oil, due to the transparency of USA’s oil output, the individual field-by-field production of the North Sea fields and PEMEX’s highly commendable data transparency. Why the world is now so complacent and simply trusts too many other key oil producers, including all the OPEC member countries, and permits all of our publicly-held oil companies to hide their key field production data makes as much sense as if we decided to abolish the global air-traffic control system and let pilots rely on hand signals. It would be a wondrous blessing if the world’s oil optimists turned out to be right. It would also be a blessing if everyone panicked about Peak Oil and created a Plan B, only to find out we had 10 to 20 more years before this plan to save the globe had to be put into action. What makes no sense is to ignore the growing amount of hard data that increasingly affirms that crude oil has peaked. In this context, it is important for people of realize that oil prices are not high. In real economic terms, oil prices have been far too low for far too long -- $100 a barrel oil is the equivalent of only 15 cents a cup. Other than municipal water, nothing of any genuine value in the world is sold as cheaply as refineries purchase crude oil.
Dr. James R. Schlesinger, United States Secretary of Defense under Presidents Nixon and Ford, Director of the Central Intelligence Agency, Chairman of the Atomic Energy Commission, and later the first Secretary to the US Department of Energy under President Carter, offered the following at a conference on petroleum in 2007, “And therefore to the peakists I say, you can declare victory. You are no longer the beleagured small minority of voices crying in the wilderness; you are now main stream. You must learn to take yes for an answer and be gracious in victory.”
Finally,
M. King Hubbert in 194925 wrote, “The present state of human affairs can best be appreciated in the light of a time perspective, minus and plus, of some tens of thousands of years from the present…On such a scale the phenomena we have discussed are represented by abrubt, near vertical rises from zero or near-zero to maximum values. The consumption of fossil fuels is thus seen to be but a “pip,” rising from zero to a maximum, and almost as sharply declining, and thus representing but a moment in the total of human history.”
Certainly there is civil unrest in Nigeria, bad weather in Mexico and the Gulf, an unfriendly government in Venezuela, the war in Iraq, deteriorating relations with Iran, pipeline problems in Alaska, conspiracies to limit production by certain OPEC countries, and a declining dollar…but now you’ve heard the rest of the story.
References
1. Speight, James G. (1999). The Chemistry and Technology of Petroleum. Marcel Dekker, pp. 215-216.
2. United States Energy Information Agency reserves estimates and CERA report on total world oil, both based on United States Geological Survey
3. Scripps Institute of Oceanography, Geosciences Research Division, “Earthguide,” at http://earthguide .ucsd.edu/fuels/oil.html
4. Encyclopedia Brittanica, Eleventh Edition article “Petroleum,” now in the public domain
5. ASTM (Amercian Society for Testing and Materials) International website, “A Timeline of Highlights.”
http:// www.astm.org/COMMIT/D02/to1899_index.html
6. Ajram, Dr. Kasem (1992). The Miracle of Islam Science, 2nd Edition, Knowledge House Publishers
7. Lapaire, Jacques. Le bitume et la mine de la Presta in Mineraux et Fossiles No. 315
8. Musee du petrole. http://www.musee-du-petrole.com/site%20anglais/page%204.htm
9. Ramos, Mary G. (2001). Oil and Texas, a Cultural History in Texas Almanac 2008-2009.
10. Boyd, Dan T. (2002), Oklahoma Oil, Past, Present, and Future, Oklahoma Geology Notes, volume 62 no. 3. Oklahoma Geological Survey
11. Paleontological Research Institution (affiliated with Cornell University), The World of Oil. http://www.priweb.org/ed/pgws/history/signal_hill/signal_hill.html
12. American Petroleum Institute (2006). History of Northern Alaska Petroleum Development. http://www.api.org/aboutoilgas/sectors/explore/historyofnorthalaska.cfm
13. Blum, Justin (2005). Alaska Oil Field's Falling Production Reflects U.S. Trend. Washington Post, June 7, 2005.
14. United States Energy Information Agency (2007). Offshore Petroleum and Natural Gas, http://www.eia.doe.gov/kids/energyfacts/sources/non-renewable/offshore.html
15. Cohen, David (2007). Upstream Economics and the Future Oil Supply, Association for the Study of Peak Oil and Gas. http://www.aspo-usa.com/index.php?option=com_content&task=view&id=189&Itemid=93
16. Alsharhan, Abdulrahman S. and Kendall, Christopher G. St. C., Precambrian to Jurassic Rocks of Arabian Gulf and Adjacent Areas: Their Facies, Depositional Setting, and Hydrocarbon Habitat, Bulletin of the American Association of Petroleum Geologists, volume 70, #8, 1986
17. Central Intelligence Agency (1991). Oil Well Fire Control and Reservoir Pressures, http://www.gulflink.osd.mil/declassdocs/cia/19960417/cia_70556_70555_01.html
18. Cordahi, James, and Critchlow, Andy (2005). Kuwait Oil Field, World's Second Largest, 'Exhausted,' from Bloomberg in Energy Bulletin, http://www.energybulletin.net/10878.html
19. Gustafson, Thane (1992). Crisis Amid Plenty: The Politics of Soviet Energy under Brezhnev and Gorbachev. Slavic Review, Vol. 51, No. 1, pp. 143-144
20. Xinhua News Agency February 6, 2004, Daqing Oilfield to Slash Output in 2004. http://www.china.org.cn/english/BAT/86495.htm
21. Institute for the Study of Global Security (2004). Energy Security. http://www.iags.org/n0331043.htm
22. Simmons, Matthew R. (2004). Twilight in the Desert, the Fading of Saudi Arabia’s Oil. Presentation to Hudson Institute, Washington D.C. on September 9, 2004.
23. Simmons, Matthew R. (2005). Twilight in the Desert.
24. Staniford (now Staniford-Chen), Stuart, PhD (2006). What Would We Have Predicted for Kuwait? From “The Oil Drum, Discussions About Energy and Our Future at http://www.theoildrum.com/ story/2006/1/20/193723/259. (Staniford is a physicist employed as a Adjunct Professor of Computer Sciences at the University of California, Davis)
25. Hubbert, M. King (1949). Energy from Fossil Fuels, in Science volume 109, number 2823.
26. Shell Oil Company (2007). Mahogany Research Project fact sheet. http://www.shell.com/static/us-en/downloads/shell_for_businesses/exploration_production/icp_fact_sheet_final.pdf
27. Seebach, Linda (2005). Shell’s Ingenious Approach to Oil Shale is Pretty Slick. Rocky Mountain News, September 3, 2005.
28. Mearns, Euan (2007). Ghawar Reserves Update and Revisions (1). The Oil Drum: Europe. http://europe.theoildrum.com/node/2507
The Author
Ty Schuiling is a native of San Bernardino, California. He graduated from the University of California, Riverside with an undergraduate degree in geology and received a Masters degree in Economic Geology from the University of Arizona after work with the US Geological Survey, Union Oil Company, and US Borax. From 1979 until its liquidation in 1986, he held positions as an exploration geologist and manager for Anaconda, a subsidiary of Atlantic Richfield. Following completion of a Masters in Urban and Regional Planning from the University of Colorado, he worked as a project manager for a national engineering consulting firm before joining San Bernardino Associated Governments (SANBAG) in 1990 as Director of Comprehensive Planning. Since 1997 he has served as SANBAG’s Director of Planning and Programming. He is married to Elizabeth Schuiling and has two daughters, Andrea and Sarah.